
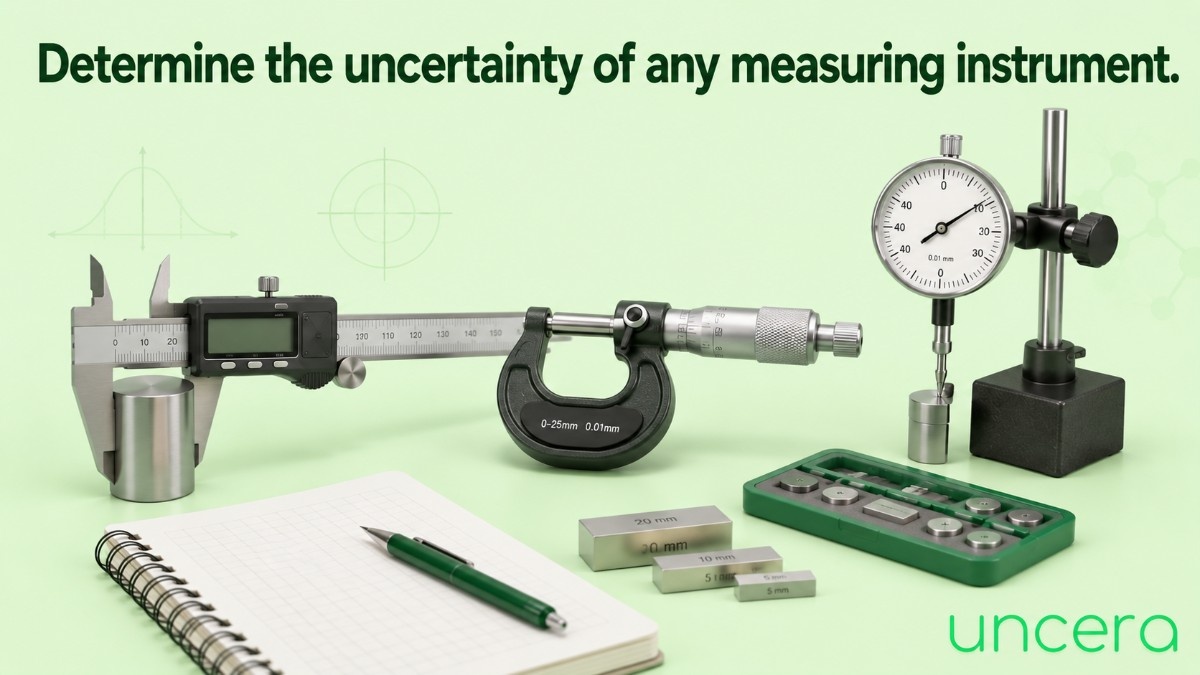
Measurement uncertainty is the honest way of saying “here is my result, and here is how much I could be off by.” It is the difference between writing 25.04 mm and writing 25.043 mm ± 0.022 mm. The second one is a real engineering result. The first one is just a number.
This guide walks you through exactly how to determine the uncertainty of any measuring instrument — vernier caliper, micrometer, pressure gauge, thermometer, or a ₹50 lakh CMM. The method is the same for all of them.
What Is Measurement Uncertainty (And Why It’s Not the Same as Error)?
Students mix these up constantly, so let’s clear it up first.
| Term | What it means | Can you know it? |
|---|---|---|
| Error | How far your reading is from the true value | No the true value is unknown |
| Uncertainty | The range where the true value probably lies | Yes you calculate it |
| Accuracy | How close a reading is to the true value (a quality, not a number) | Described, not calculated |
| Tolerance | What the design allows the part to vary by | Given on the drawing |
How Do I Determine the Uncertainty of Any Measuring Instrument:

This is the core process, based on the GUM (Guide to the Expression of Uncertainty in Measurement) the international rulebook that ISO/IEC 17025 labs follow.
Step 1: Define what you are measuring
Write it down clearly: “The diameter of a steel shaft at mid-length, at 20 °C, using a digital caliper.” Vague measurand, vague uncertainty.
Step 2: List your uncertainty sources
Use the 5M list above. Keep it to the sources that genuinely contribute.
Step 3: Evaluate Type A uncertainty (from your own repeated readings)
Type A means you got the number from statistics on your own data.
Take at least 10 readings of the same feature. Then:
- Calculate the mean:
x̄ = Σx / n - Calculate the sample standard deviation:
s = √[ Σ(x − x̄)² / (n − 1) ] - Calculate the standard uncertainty of the mean:
u_A = s / √n
That √n is why repeating measurements helps: 4 readings halve this component, 9 readings cut it to a third.
Step 4: Evaluate Type B uncertainty (from everything else)
Type B means you got the number from a document, a spec sheet, or your judgement not from your own repeated readings.
Each Type B source arrives in a different form, so you must convert it to a standard uncertainty using its probability distribution:
| Source | What you know | Convert using |
|---|---|---|
| Calibration certificate | U = 0.02 mm, k = 2 | u = U / k |
| Resolution / least count | Digital display steps of d | u = d / (2√3) |
| Manufacturer spec / limits | “±a”, no other info | u = a / √3 (rectangular) |
| Value most likely at centre | “±a”, peaked | u = a / √6 (triangular) |
Why the √3? If all you know is that the value sits somewhere between −a and +a, with no value more likely than another, that’s a rectangular distribution and its standard deviation is a/√3. Dividing by √3 (≈ 1.732) converts a limit into a standard uncertainty so it can be combined with the others fairly.
Step 5: Apply sensitivity coefficients (only if units differ)
If a source is in different units than your result for example, temperature in °C affecting a length in mm multiply it by a sensitivity coefficient c to convert it.
For thermal expansion: c = L × α, where α is the coefficient of thermal expansion (steel ≈ 11.5 × 10⁻⁶ /°C).
If a source is already in your output units (like resolution in mm), then c = 1 and you can skip this.
Step 6: Combine everything (root sum of squares)
You never just add uncertainties that would assume every source goes wrong in the same direction at the same time, which is unrealistically pessimistic. Instead, add them in quadrature:
u_c = √( (c₁u₁)² + (c₂u₂)² + (c₃u₃)² + ... )
This is the combined standard uncertainty. It gives roughly a 68% confidence level.
Step 7: Expand it and report properly
68% is not good enough for engineering decisions. Multiply by a coverage factor k:
U = k × u_c
Use k = 2 for approximately 95% confidence. This is the industry default. (k = 3 gives ~99.7%, used for safety-critical work.)
Report it like this:
Diameter = 25.043 mm ± 0.022 mm The reported expanded uncertainty is based on a standard uncertainty multiplied by a coverage factor k = 2, providing a level of confidence of approximately 95%.
That second sentence is mandatory in a formal report. Without stating k, your number means nothing.
Worked Example: Uncertainty Budget of a Digital Vernier Caliper
Let’s put all 7 steps together. We are measuring a steel shaft diameter with a digital caliper of resolution 0.01 mm.
Data collected: 10 readings, mean x̄ = 25.043 mm, standard deviation s = 0.012 mm
Type A:
u_A = 0.012 / √10 = 0.0038 mm
Type B – calibration certificate says U = 0.02 mm at k = 2:
u_cal = 0.02 / 2 = 0.0100 mm
Type B – resolution is 0.01 mm, so the half-width is 0.005 mm:
u_res = 0.005 / √3 = 0.0029 mm
Type B – temperature, workshop varies ±2 °C from 20 °C:
Half-width = L × α × ΔT = 25 × 11.5×10⁻⁶ × 2 = 0.00058 mmu_temp = 0.00058 / √3 = 0.0003 mm
The uncertainty budget
| # | Source | Type | Distribution | u (mm) | u² (mm²) |
|---|---|---|---|---|---|
| 1 | Repeatability | A | Normal | 0.0038 | 0.0000144 |
| 2 | Calibration certificate | B | Normal (k=2) | 0.0100 | 0.0001000 |
| 3 | Resolution | B | Rectangular | 0.0029 | 0.0000084 |
| 4 | Temperature | B | Rectangular | 0.0003 | 0.0000001 |
| Sum | 0.0001229 |
Combined standard uncertainty:
u_c = √0.0001229 = 0.0111 mm
Expanded uncertainty at k = 2:
U = 2 × 0.0111 = 0.022 mm
Final result: 25.043 mm ± 0.022 mm (k = 2, ~95% confidence)
Notice something important: the calibration certificate contributed the most (0.0100 of the total). Buying a caliper with finer resolution would barely help here. Getting a better calibration would. That is the real value of building an uncertainty budget it tells you where to spend your money.
Common Mistakes Students Make With Measurement Uncertainty
❌ Adding uncertainties directly instead of using root sum of squares. Adding gives you a wildly inflated number. Always square, sum, then take the square root.
❌ Reporting ±U without stating the coverage factor. ± 0.022 mm alone is ambiguous. Always write (k = 2).
❌ Using least count ÷ 2 as “the uncertainty.” That is only one Type B component, and it still needs dividing by √3. It is not the whole answer.
❌ Taking only 3 readings. With such a small sample the standard deviation is unreliable. Aim for 10.
❌ Quoting too many digits. Round the uncertainty to 2 significant figures, then round the result to the same decimal place. 25.0431 ± 0.0221 should be 25.043 ± 0.022.
❌ Ignoring temperature on long parts. For a 25 mm shaft it was negligible. For a 1000 mm steel bar with a ±5 °C swing, the same calculation gives 0.033 mm larger than everything else combined.
❌ Confusing uncertainty with tolerance. A good rule of thumb: your measurement uncertainty should be no more than 1/4 to 1/10 of the part tolerance. If the tolerance is ±0.02 mm and your uncertainty is ±0.022 mm, your instrument cannot judge that part at all.
Frequently Asked Questions
What is the difference between Type A and Type B uncertainty?
Type A is evaluated statistically from your own repeated measurements you calculate a standard deviation. Type B is evaluated from any other source: calibration certificates, manufacturer specifications, resolution, handbooks, or reasoned judgement. Both are converted into standard uncertainties and combined the same way. Neither one is “better” or more reliable than the other.
Why do we divide by √3 for resolution and rectangular limits?
Because when you only know that a value lies somewhere between two limits, with every value inside equally likely, that describes a rectangular (uniform) distribution and the standard deviation of a rectangular distribution with half-width a is a/√3. Dividing converts a “limit” into a “standard uncertainty” so all sources can be combined on the same statistical footing.
What value of k should I use?
Use k = 2 for approximately 95% confidence. This is the default in nearly all industrial and ISO/IEC 17025 accredited work. Use k = 3 (~99.7%) only when a failure would be safety-critical. If you have very few readings, a more rigorous approach uses effective degrees of freedom (Welch–Satterthwaite) to select k, which usually pushes it slightly above 2.
How many readings should I take for Type A evaluation?
At least 10 is the practical standard. Fewer than 6 makes the standard deviation itself unreliable. Since u_A = s/√n, going from 10 to 40 readings only halves this one component so once Type A stops dominating your budget, extra readings are wasted effort.
Can I find the uncertainty of an instrument without a calibration certificate?
You can estimate it, but the result is much weaker. Without a certificate you have no metrological traceability no documented link back to national standards so you would have to fall back on the manufacturer’s accuracy specification as a rectangular Type B component. For any formal, audited, or customer-facing measurement, a valid calibration certificate is required.
Does uncertainty apply to digital instruments too?
Yes, completely. A digital display looks authoritative, but it still has calibration uncertainty, drift, resolution limits, and it is still affected by temperature and operator technique. Digital removes parallax error it removes nothing else.
Is uncertainty the same as the ± number printed in the instrument catalogue?
No. The catalogue figure is the manufacturer’s accuracy specification for the instrument alone under ideal conditions. Your measurement uncertainty also includes your operator, your part, your environment, and your method so it is almost always larger.
Conclusion
Determining the uncertainty of any measuring instrument comes down to a repeatable seven-step routine:
- Define the measurand clearly
- List your uncertainty sources using the 5M framework
- Evaluate Type A from repeated readings –
s/√n - Evaluate Type B from certificates, resolution, and specs divide by
kor√3 - Apply sensitivity coefficients where units differ
- Combine using root sum of squares
u_c - Expand with
k = 2and report with the confidence statement
